A Brief History
Have you ever had to wait for a long time in the ER? Wondering why that guy with the broken toe was called up before you? This is triage. Triage is the process by which medical providers can sort incoming patients based on resource availability and patient requirements. Now let’s back up a bit. What is this triage thing? The word triage comes from the French word “trier” meaning “to sort”. Around 1792 this handsome guy (below) was the general surgeon of Napoleon’s Imperial Guard.

After the consistent bombardment of injured soldiers on a few ill-equipped doctors, Baron Dominique Jean Larrey (what a name) thought “Hey guys. I think there’s a better way.” Thus the original form of triage was born, and the French “ credited [Larrey] with designing a flying ambulance.”
The disaster relief form of triage implemented by Larrey consisted of placing tags on incoming patients with colors and text to address categories such as “dead”, “immediate”, “minor”, etc. This allowed medical providers at the time to quickly prioritize and allocate resources toward those patients who could benefit the most at a given time. Emergency rooms today still use a form of triage based on this, however, a 1–5 scale is used instead of colored tags.
The Problem
Ok….now why have I dragged you through this triage history? I believe knowing the context of a system is the best way to start iterating and improving. And what better way to iterate on a sorting problem than a computer? *cough binary search cough bubble sort cough merge sort cough.* What if we could use an algorithm to prioritize patients for us rather than expending the time to generate a rating that may not even be consistent between providers? Umm….good thing we’re data scientists!
To simplify this problem, I’ll be focusing on the distinction between admitted patients (those who will stay overnight and require many resources) and temporary patients (those who will leave within the day and require fewer resources). My justification for this as opposed to the granularized approach Larrey presented is two-fold:
The groups are distinct, so the algorithm will be more reliable and accurate
Including median stay and total hospital operating costs, the cost per admitted patient to a hospital could top $6000. This indicates a much more significant burden on hospital resources than those patients who stay a matter of hours.
Because there are two target conditions to predict, this is a classification problem with a binary outcome (1: admitted; 0: not admitted).
The Data
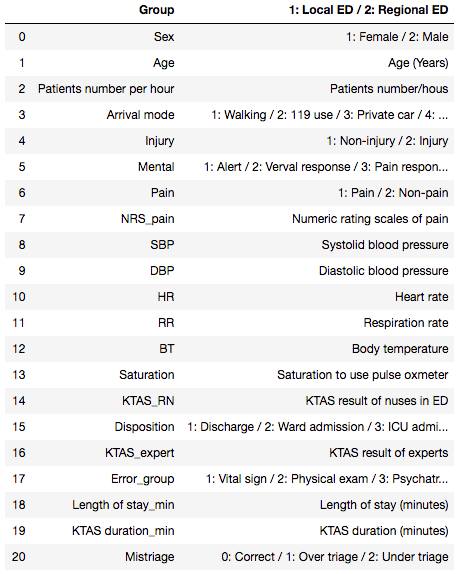
The data I used to train this classifier comes from a Korean triage study across 2 hospitals. In its raw state, there were approximately 1200 rows and 24 features. A subset of the original features is below:
Cleaning and Feature Engineering
These data were reasonably messy with the usual suspects: nulls, odd labeling, irrelevant features, nonuniform distributions, etc. A few steps I took to clean the data and prepare for modeling:
Removed the features which would not contribute toward this analysis.
Imputed median values for nulls
Binned the discrete, nonuniform features into broader categories.
Created dummy variables for categorical features
Built the predicted feature (y) from an original feature in the dataset called “disposition”. This indicates where the patient went after assessment. I categorized things like “ward admission” as admitted while things like “discharge” were not admitted.
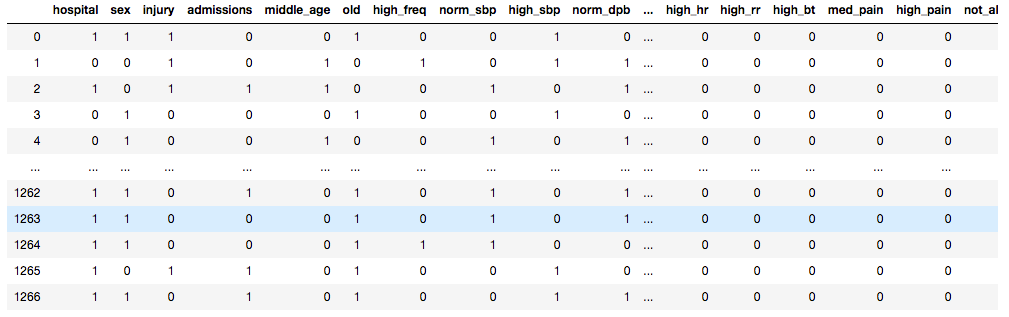
The clean data frame (with dummies) looked like this:
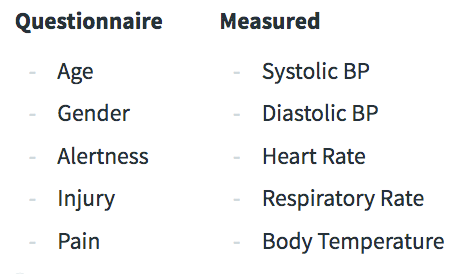
The final features for the model are grouped below. They are split by those taken from a questionnaire upon ER entry and those vitals measured by a nurse.
The target (admitted vs not admitted) was unbalanced (we’ll deal with that snag later):

Modeling
Before diving into the modeling let’s talk about metrics. I’m going to use a weighted score (called Fbeta) of two important classification metrics: precision and recall. Precision indicates my true positives from my actual results. This is, out of all admissions I predicted, how many patients were actually not admitted (false positives)? Recall describes my true positives from my predicted results. This is, out of everything I predicted, how many admissions did I miss (false negatives)? If I have low precision I could end up over-allocating resources because I predict more patient admissions than reality. Low recall, however, could mean that I miss patients who should be admitted. Recall is more important to me here because I’d rather over-allocate resources than under-allocate. To prioritize recall while also ensuring that I’m not hugely over-allocating resources, I weighed my beta value more heavily toward recall to strongly penalize models with poor recall. Below is an example of one confusion matrix I generated:
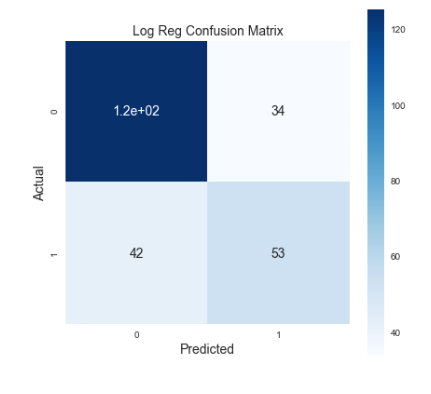
See that bottom left corner with the answer to life, the universe, and everything? Those are my false negatives. The higher that number gets, the more people I thought were not going to be admitted surprise me by being admitted. And all of a sudden I’m unprepared with no beds or resources to house them. I’d like to move as many of those to the right side as possible.
Ok. Now we know what to measure. On to the next problem. Remember that nasty class imbalance problem we have? Turns out most people rolling through the ER are going to be patched up and out by the end of the day. The admitted class represents a smaller subset. I decided to upsample the minority class using a few different methods including random oversampling, ADASYN, and SMOTE. I ultimately settled on random oversampling by analyzing ROC curves across various models. Below are the models I considered with random oversampling, kfold cross-validation, and mean FBeta as a metric.
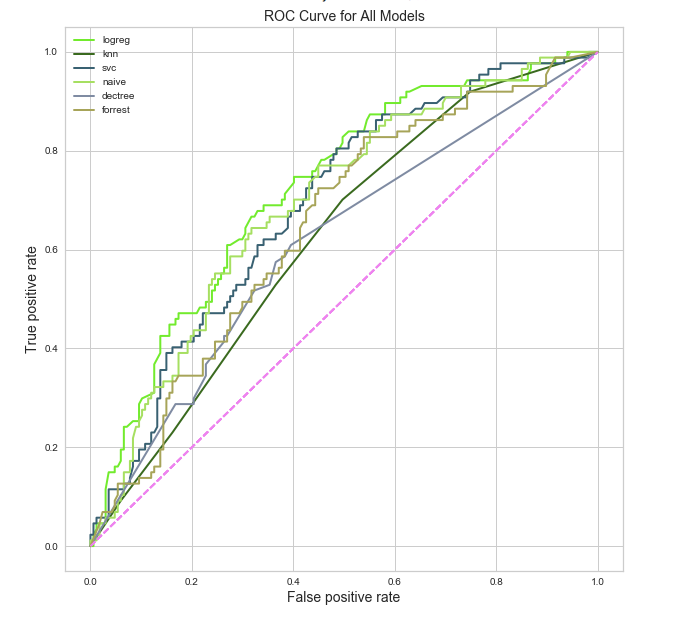
Logistic regression seems to be the winner in this instance (with an FBeta of 0.65). In addition to high FBeta, Logistic regression is a good choice because I’ll be able to interpret the features. Below is a plot of coefficient magnitude.
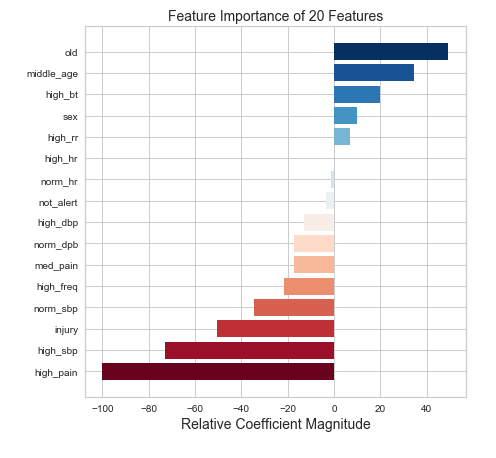 Just don’t get old I guess?
While I don’t really need to know feature importance for predictive power it is nice to show a bit of insight. The model above doesn’t offer any hints about the triage score. Why? This is intentional. How can we automate triage if we give our model the answers? I did, however, want to see how performance could change given this information. And, not shockingly, the model gets better. An FBeta of 0.68 can be achieved by indicating some rating 1–5 of patient severity.
So. Machine learning is great. The model is great. Excellent. Where is the triage bot? We could call him BOTriage (work in progress). Anyway…here is the sample app I created to simulate automated triage:
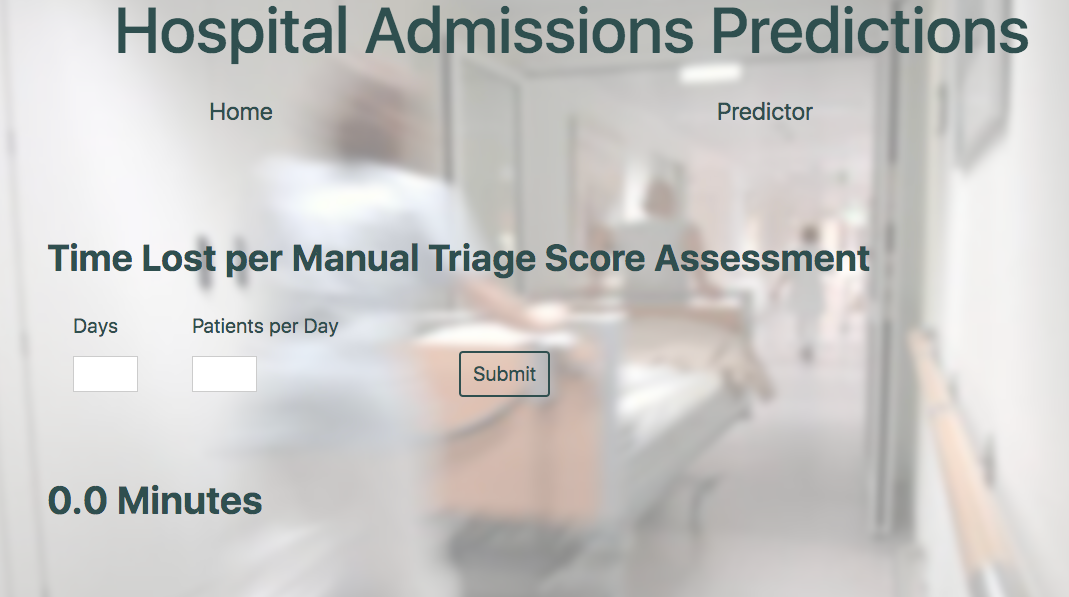 For dramatic effect, you can look at how much time could be wasted manually assessing triage
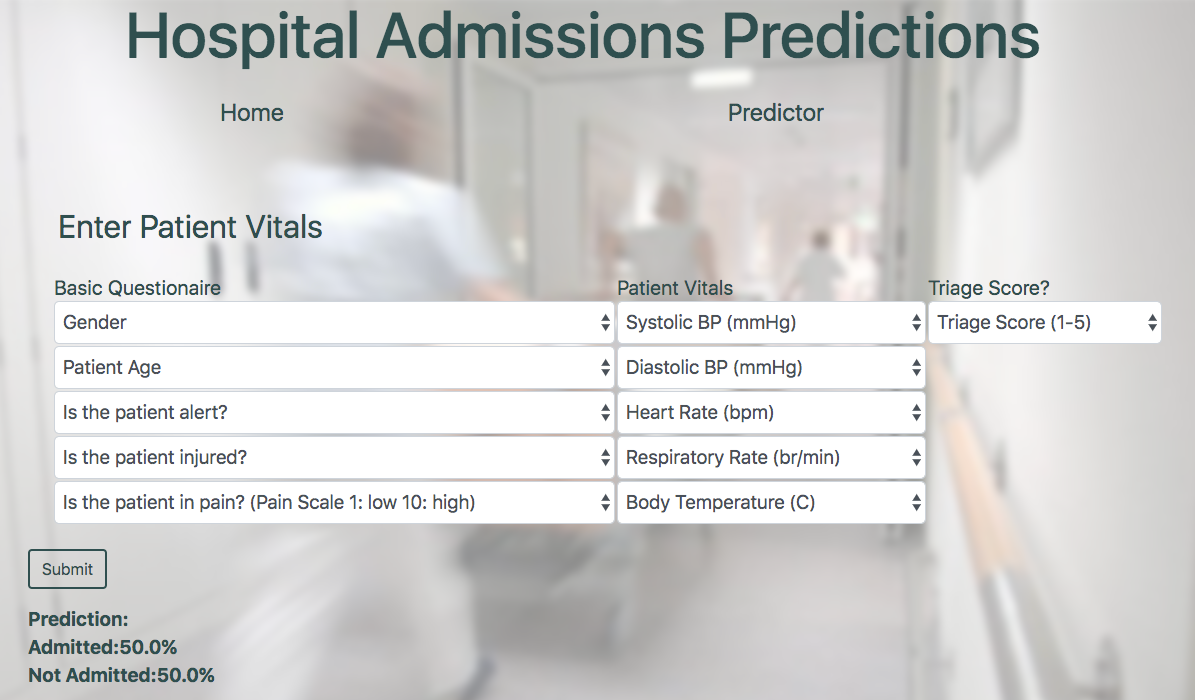 The prediction page (BOTriage) offering “Admitted” or “Not Admitted” and the percent strength of prediction.
That’s all folks! Thanks for tuning in, and at the very least if anyone asks you about triage in the future you can refer them to “that French guy who invented the flying ambulance”. If you are interested to learn more about this project, code can be found on my GitHub or you can reach out to me here.
Resources
Triage History: https://www.ncbi.nlm.nih.gov/pmc/articles/PMC2564046/
Hospital Admissions Cost: https://www.ncbi.nlm.nih.gov/pmc/articles/PMC3303656/